Posts

Reliability Calculations in Excel
Image
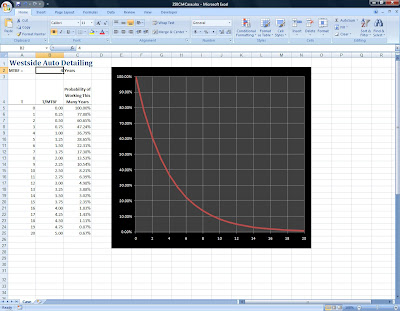
In Operations Management today we used Excel to calculate product reliability. Reliability is defined as "the ability of a product, service, part, or system to perform its intended function under a prescribed set of circumstances" (Stevenson, 2009). In order to calulate reliability over a given length of time we need to use the following formula: P(no failure) = e -t/MTBF where: e = 2.7183 t = Length of service before failure MTBF = Mean Time Between Failures One of the cases we did in class involved an auto detailing company that wanted to calculate the reliability of its vacuum cleaners. Excel provides an "EXP" funtion that we can easily apply here. After entering all data for the problem as shown on the spreadsheet below, we type the formula =EXP(-A5/$B$2) in cell B5 and copy down. Next we plot the distribution for t=0 to the maximum life expectancy of 20 years using a line graph. What we end up with looks like a classic case of "ex...

Five Things to Know Before You Upgrade to Windows 7

Image
October 23, 2009 (PC World) - Now that Windows 7 is here, the three out of four users who have rejected Windows Vista and clung to the tried and true Windows XP can breathe a sigh of relief and consider moving to the new flagship operating system. Upgrading or switching operating systems often comes with some trials and tribulations and the Windows 7 upgrade is no exception. Microsoft has tried to provide the tools users need to make the transition as easy as possible, but you may hit some snags. Here are five things you should be aware of as you upgrade from Windows XP to Windows 7: 1. You can't upgrade directly. Unfortunately, Microsoft has not provided Windows 7 with the capability to upgrade directly from Windows XP. The explanation is that so much has changed between Windows XP and Windows 7 within the operating system kernel itself, the Registry, the drivers, etc. that trying to get from Point A to Point B just won't work. That isn't as horrible as it sounds. Frankly,...

Excel Solver for Business Decisions

Image
Today in Operations Management we did a case study using the Excel Solver "Add-In." In this example the company sells three products (A, B, and C). An Income Statement calculates the profitability of each product and the goal is to "maximize" profit for the entire company given the constraints on Labor Costs, Materials, and Sales. Students were required to enter all of the information from the case into the spreadsheet and then configure the Solver parameters in order to come up with a solution. The "Target Cell" is of course, profit. The "Changing Cells" are the "optimum" number of units of Product A, B, and C that will be produced as determined by the Solver. Constraints include how much of each resource is available as well as how many of each product can be sold at best. Once everything was entered, all that needed to be done was to click the "Solve" button and let Excel find an answer. The model assumes the solution w...

Patch Day

October 14, 2009 (AP) - Microsoft Corp. issued a record number of security patches for its software Tuesday as part of its regular monthly update. The software maker plugged 34 holes and designated most of them "critical," Microsoft's most severe rating. Among them are fixes for Windows Vista, Windows XP, Windows 2000 and even Windows 7, which doesn't go on sale to consumers until Oct. 22 but has been in use by early testers and software developers. (Msnbc.com is a NBC Universal-Microsoft joint venture.) The patches target a wide array of Microsoft software, including the Internet Explorer Web browser, Media Player, Outlook and the Silverlight technology underlying multimedia Web sites. Security researchers at McAfee Inc., which makes antivirus software, noted that many of the holes addressed Tuesday are dangerous because they expose regular PC users to harmful programming code when they visit rigged Web sites or play media files that have been tampered with. Consume...

They Can Read Your Mind

Image
September 25, 2009 (Wired) - Scientists are one step closer to knowing what you've seen by reading your mind. Having modeled how images are represented in the brain, the researchers translated recorded patterns of neural activity into pictures of what test subjects had seen. Though practical applications are decades away, the research could someday lead to dream-readers and thought-controlled computers. "It's what you would actually use if you were going to build a functional brain-reading device," said Jack Gallant, a University of California, Berkeley neuroscientist. The research, led by Gallant and Berkeley postdoctoral researcher Thomas Naselaris, builds on earlier work in which they used neural patterns to identify pictures from within a limited set of options. The current approach, described this week in Neuron, uses a more complete view of the brain's visual centers. Its results are closer to reconstruction than identification, which Gallant likened to ...

Excel "X-Bar" Control Charts

Image
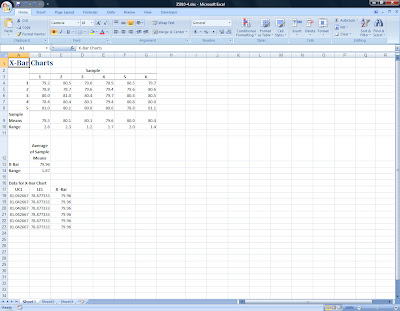
September 14, 2009 - Continuing our discussion of Total Quality Management, today we created "X-Bar" charts in Excel. The case we studied involved a computer repair company that makes visits to homes and business. Repair calls have historically averaged 80 minutes per call. Management wishes to construct "3 Sigma" control charts to decide if service call times are "in control." Six samples of five observations were taken, the sample means and ranges have been calculated and the data are as shown in the following Excel worksheet: The formulas used in this worksheet are: Sample Means: =AVERAGE(B4:B8), enter in cell B9 then copy across to the other five samples. Range: =MAX(B4:B8)-MIN(B4:B8), enter in cell B10 then copy across as before. Average of Sample Means: =SUM(B9:G9)/6 for X-Bar (cell B13) and =SUM(B10:G10)/6 for the Range (cell B14). Using a table of factors for "3 Sigma" X-Bar charts, (Source: Grant and Leavenworth, Statistical Quality C...

Excel Pareto Digrams and Run Charts for Total Quality Management

Image
September 9, 2009 - Today in my Operations Management class, we analyzed customer complaint data for a small grocery chain. Over a nine week period, "Tip Top Markets" had been collecting data on customer complaints. Examples included comments such as: "stale bread," "overcharged," "checkout lines too long," "meat spoiled", "out of 42 oz tide," "eggs cracked," and "store not clean." Students first tallied the complaints for each week using five categories and entered the data into an Excel spreadsheet: After calculating total complaints for each category as well as the cumulative percentage, they created a Pareto Diagram and Run Chart as shown: According to the Pareto Diagram, "Tip Top" has real quality issues in the areas of "Out of Stock Items" and "Service and Maintenance." The Run Chart shows over time how, after implementing a quality improvement program, their stores ha...