Graphing Reliability Using Excel

The reliability of a component is measured by the mean time between failures (MTBF). It is the average time until failure and is typically provided in hours or years. A MTBF of 10 years means that, on average, every 10 years a failure occurs, based on a large sample. These numbers are typically provided in the component data sheets of the hardware manufacturers.
There are two problems associated with using the MTBF:
1. The values for MTBF can vary significantly, especially
for components with moving parts like disk drives. This is because the MTBF
depends greatly on the quality of the individual production batch which is far
from constant. Manufacturers obviously try to detect quality problems, but this
is not easy, as the manufacturing of complex components is more an art than a
science. There are many variables, like calibration of machinery, impurities in
the clean room, quality of materials, etc.
2. The appearance of failures does not follow a uniform
distribution. The failure rate is high for new equipment (early mortality) and
if equipment reaches its end of life. The time in-between is when we want to
use the equipment for production.
However, manufacturers provide very impressive numbers for
MTBF. For example, 106 hours (about 114 years) for a disk drive is a
standard value nowadays.
The inverse of the MTBF is the failure rate. The annual
failure rate (AFR) is defined as the average number of failures per year:
For example, consider a disk drive with MTBF of 300000 hours
or 34 years. The corresponding AFR is 0.029 failures per year. If your disk array
contains 200 such drives, you can expect one failure every 2 months. The
following table lists typical mean time between failures (MTBF) and annual
failure rate (AFR) values for common computer components:
|
|
MTBF Hours |
MTBF Years |
AFR |
|
Disk Drive |
300000 |
34 |
0.0292 |
|
Power Supply |
150000 |
17 |
0.0584 |
|
Fan |
250000 |
28 |
0.0350 |
|
Interface Card |
200000 |
23 |
0.0438 |
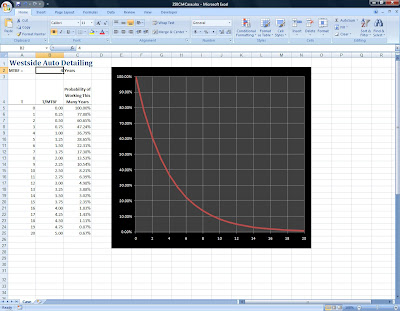
The formula used to calculate Reliability is: e-t/MTBF
(Stevenson, 2019). In my MGT 350 Operations Management class, we
create a worksheet similar to the Microsoft Excel example below. Using Excel, this
formula is represented as =EXP(-A5/$B$2). To finish the worksheet, we simply
copy everything down to row 2005:


It is interesting to observe how quickly Reliability
declines. At 300,000 hours, the reported MTBF, Reliability is only 36.79% and
as we get farther out, the curve approaches 0%. We do a case study in MGT 350 for an autodetailer and there are a few vaccuums still working after 15 years. As they say "It was a good day at the factory!"
Source: High Availability and Disaster Recovery: Concepts, Design, Implementation
Authors: Schmidt, Klaus
Year: 2006